Stock Investing and Trading System
|
Top Stock Picks
 |
| |
Stock Charts |
|
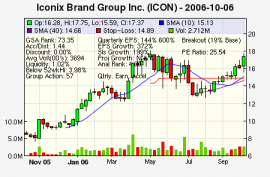
It's been said that a picture is worth a thousand words. That being true, the same can be stated about stock charts. Stock charts provide you with an unbiased view of the stock's trading price and volume history. For stock market investors, longer time period stock charts are useful, e.g., 3 or 5-year stock charts or longer. Shorter term day traders may find daily or hourly stock charts more useful. Stock charts provide investors with a visual idea of where the stock has traded compared to prior periods. Is the stock at its 52-week high or 52-week low? Do the stock charts depict an upward trend or are the stock charts showing a period of consolidating price patterns? Learning to read and understand stock charts takes time, patience and study. Here at Growth Stock Analytics, we make exhaustive use of stock charts before stock selections are made. Join us to enhance your ability to read stock charts, improve your stock picks and boost your stock portfolio. Growth Stock Analytics supplies stock market investors entry to our proprietary stock numbering system. Our HI-EPSRSTM Stock Database
is a one-stop starting point for stock charts, and research/investing in high relative strength stocks:
- Receive our Top Stock Picks.
- Perform Stock Screening.
- Observe Stock Chart Samples.
- Look for Stock Breakouts.
- Validate Fundamental and Technical Statistics.
- Monitor your Portfolio using Portfolio Alerts.
- Stock Charts, and more...
|
Testimonials"Hi! Great site! I was thinking of subscribing and was just wondering how many top picks you have going on average at one time. I'd like to just trade all of your top picks but if it goes over 10 stocks at one time it might be a little difficult.
You must have many clients who have done well with your system over the years-good job. It's nice to see that with some disciplined trading rules people can be successful with a little patience."...CM, Wisconsin
|
|
Join now, for stock charts. Remember, all the work has been done for you.
Become A Member - Join Now!
|
The Web Counter welcomes you as visitor  since June 15, 1996. since June 15, 1996.
|
| |


 Disclaimer The stock selections in our stock investing and stock trading database are not stock recommendations, but simply represent applications of a stock investing process. All materials, including our Top Stock Picks, are provided for information purposes only and should not be used or construed as an offer to sell, a solicitation of an offer to buy, or a recommendation for any security. Growth Stock Analytics, LLC is not responsible for gains/losses that may result in investing or trading in these securities. All information is believed to be obtained from reliable sources, but there is no guarantee that the information supplied is accurate, complete or timely. There is no guarantee or warranty with regard to the results obtained from its use. There is no guarantee of suitability or potential value of any particular investment or information source. You acknowledge that your requests for this information are unsolicited and shall neither constitute nor be considered investment advice. Past investing performance is not an indication of future performance results. Investing and trading in stocks is risky. Investors are encouraged to consult a registered stock broker or investment adviser before making any investing decisions. The interpretations and opinions expressed herein are solely those of Growth Stock Analytics, LLC, and not of any other individual or organization.